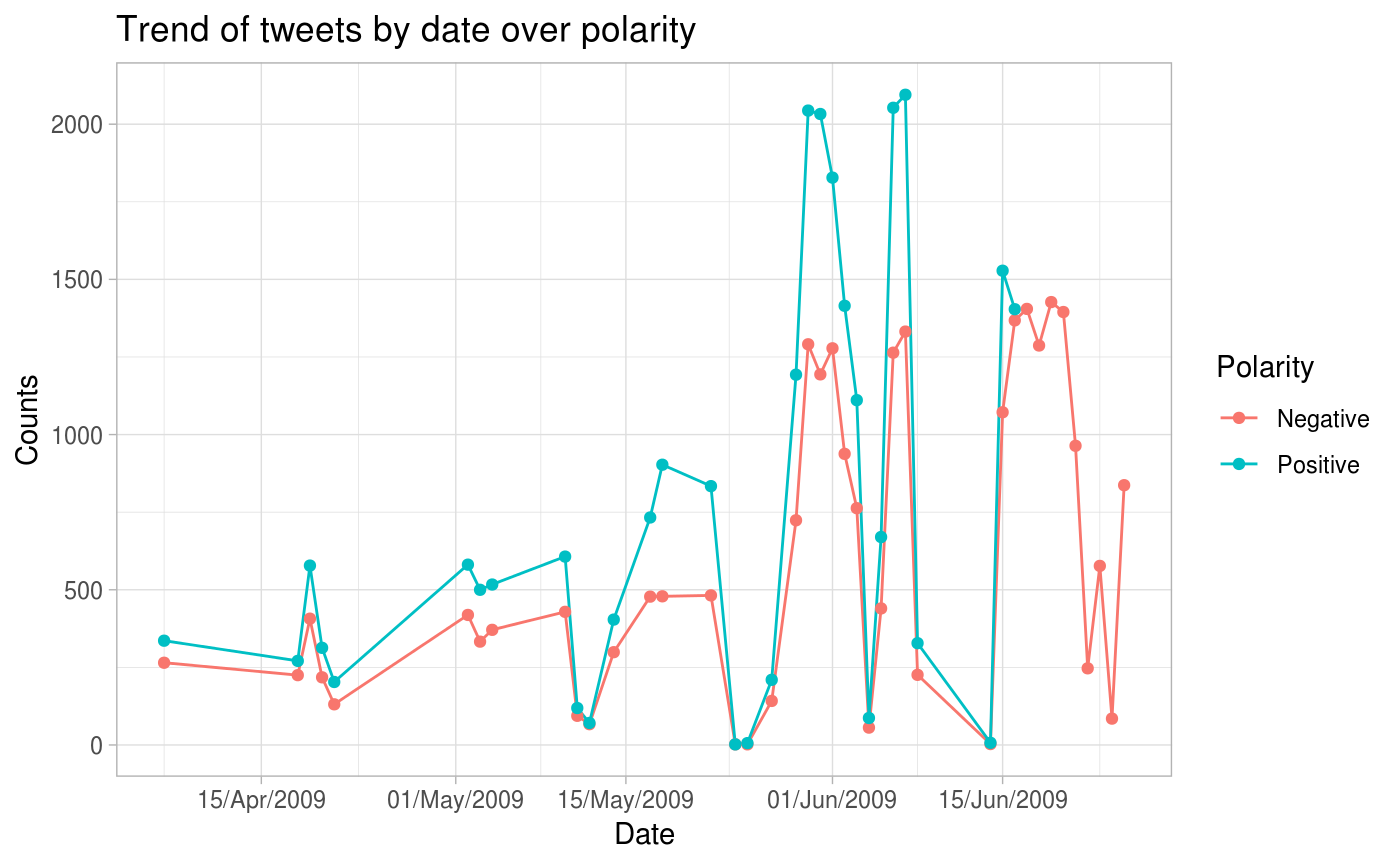
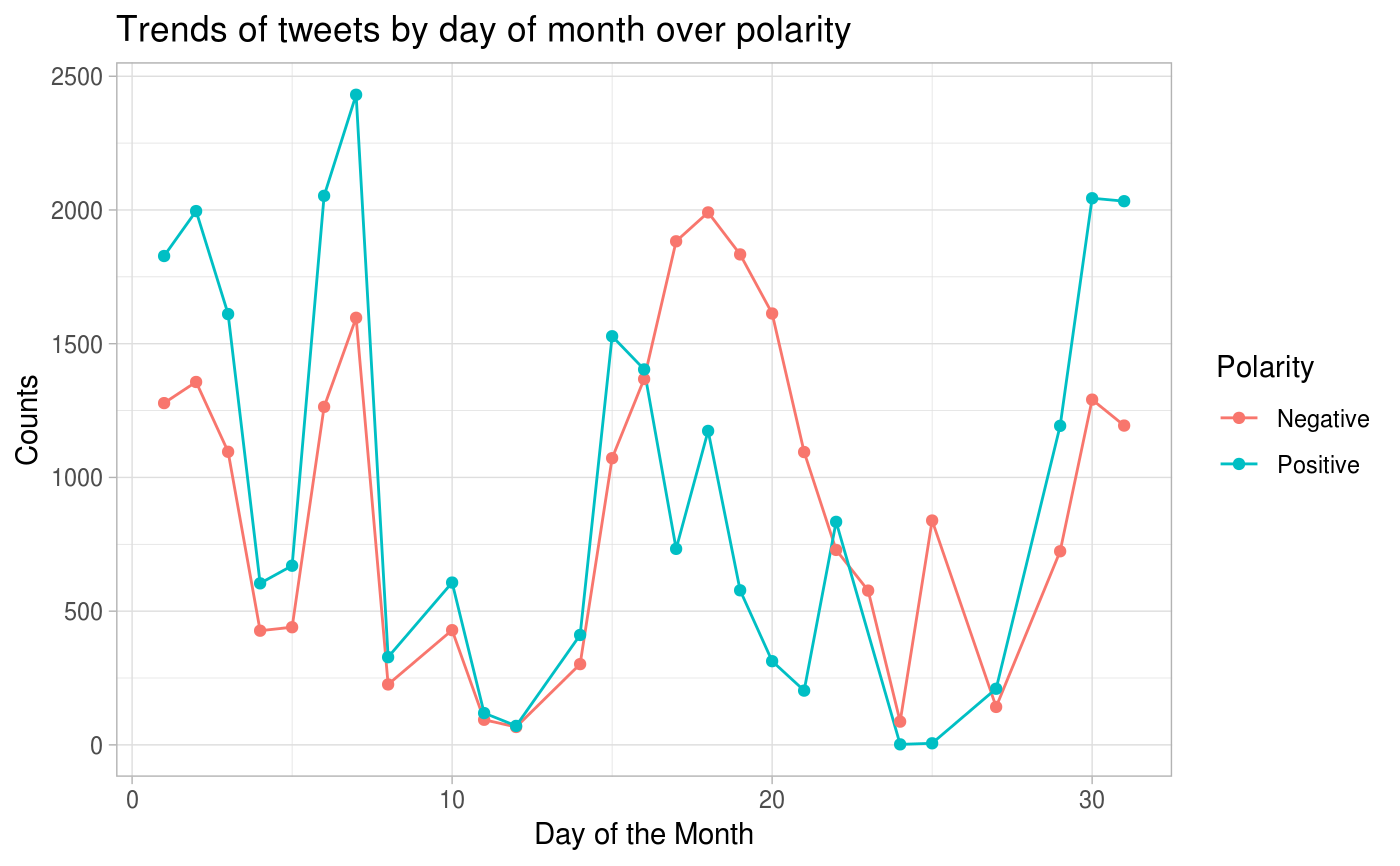
Generate time series plots to analyze given data with filters and visualize over polarity and return the raw data, date/day aggregate data and a plots for the same.
Arguments
| data | the sentiment140 train or test data containing variables |
|---|---|
| user_list | a vector of users for which to filter the dataset |
| start_date_time | input start_date_time in POSIXct format on which to filter the dataset |
| end_date_time | input end_date_time in POSIXct format on which to filter the dataset |
| keyword_list | a list of string keywords on which to filter the dataset |
Value
a list object with raw filtered dataframe, date_counts aggregated dataframe that holds the frequency counts of date by polarity, day_counts aggregated dataframe that holds the frequency counts of day by polarity and a plots depicting their relationship.
Examples
time_series()#> $raw
#> # A tibble: 50,000 x 14
#>    polarity      id date                query user  text  nouns adjectives
#>    <chr>      <int> <dttm>              <chr> <chr> <chr> <int>      <int>
#>  1 Negative  2.01e9 2009-06-03 09:26:56 NO_Q… Nina… n fe…     3          0
#>  2 Positive  1.93e9 2009-05-27 05:45:38 NO_Q… RBCK… @ong…    14          1
#>  3 Negative  2.05e9 2009-06-06 02:27:00 NO_Q… t3ll… an m…     4          2
#>  4 Negative NA      2009-06-19 18:58:49 NO_Q… Joyc… nd n…     7          0
#>  5 Positive  2.07e9 2009-06-07 17:56:22 NO_Q… Shau… @yan…     4          3
#>  6 Positive  1.56e9 2009-04-19 19:00:50 NO_Q… shor… @ust…     4          1
#>  7 Positive  1.84e9 2009-05-18 12:35:39 NO_Q… molt… orni…     5          0
#>  8 Negative  2.07e9 2009-06-07 21:14:40 NO_Q… chel… Pod …     3          0
#>  9 Negative NA      2009-06-17 07:38:41 NO_Q… call… an't…     6          1
#> 10 Negative NA      2009-06-25 08:50:36 NO_Q… Love… " wi…     2          0
#> # … with 49,990 more rows, and 6 more variables: prepositions <int>,
#> #   articles <int>, pronouns <int>, verbs <int>, adverbs <int>,
#> #   interjections <int>
#>
#> $date_counts
#> # A tibble: 73 x 3
#>    date       polarity count
#>    <date>     <fct>    <int>
#>  1 2009-04-07 Negative   265
#>  2 2009-04-07 Positive   336
#>  3 2009-04-18 Negative   225
#>  4 2009-04-18 Positive   271
#>  5 2009-04-19 Negative   407
#>  6 2009-04-19 Positive   578
#>  7 2009-04-20 Negative   218
#>  8 2009-04-20 Positive   313
#>  9 2009-04-21 Negative   131
#> 10 2009-04-21 Positive   203
#> # … with 63 more rows
#>
#> $day_counts
#> # A tibble: 53 x 3
#>      day polarity count
#>    <int> <fct>    <int>
#>  1     1 Negative  1278
#>  2     1 Positive  1828
#>  3     2 Negative  1357
#>  4     2 Positive  1996
#>  5     3 Negative  1096
#>  6     3 Positive  1611
#>  7     4 Negative   427
#>  8     4 Positive   604
#>  9     5 Negative   440
#> 10     5 Positive   670
#> # … with 43 more rows
#>
#> $plot_date#>
#> $plot_day#>